源数据白皮书
Concise Introduction to The 23MF_V2 High-Density SNP Array and The Chip Analysis Guidelines
1. Introduction
In today’s era of personal genomics, the development of appropriate guidelines for the accurate and efficient analysis of genomics data is of critical importance. At present, many direct-to-consumer DNA testing companies offer testing based on a range of commercially available genotyping arrays. Most of these companies offer a diverse range of services such as human ancestry, health testing, carrier screening for inherited genetic disorders, nutrigenetic testing and genetic relatedness testing. However, because different companies have different bioinformatics analysis pipelines and use their own analysis standards, the quality of the results can vary widely.
In this paper, we describe the steps we undertook in the selection and optimization of the 23MF_v2 high SNP density array, and we outline the highlights of the array, including an improved method for genotype imputation and trios phasing. Finally, we discuss the limitations of the analysis and its future refinement.
2. Selection of gene loci for the 23MF_v2 high-density SNP array
As a company, 23MoFang is dedicated to providing high quality direct-to-consumer genetic testing. Our mission is to digitize life and benefit lives. As part of this we strive to develop genetic testing methods that are publicly affordable from the outset. That is why we chose the Axiom Precision Medicine Research Array (PMRA) as our chip prototype.
Axiom PMRA is a newly developed and highly affordable genotyping array with comprehensive, high-value content for direct-to-consumer applications. The chip was originally manufactured by Affymetrix Inc., and includes genomic content to aid in the translation of research results into clinical insight, enabling the development of new, more effective treatments and wellness plans based on genetic, environmental, and lifestyle factors.
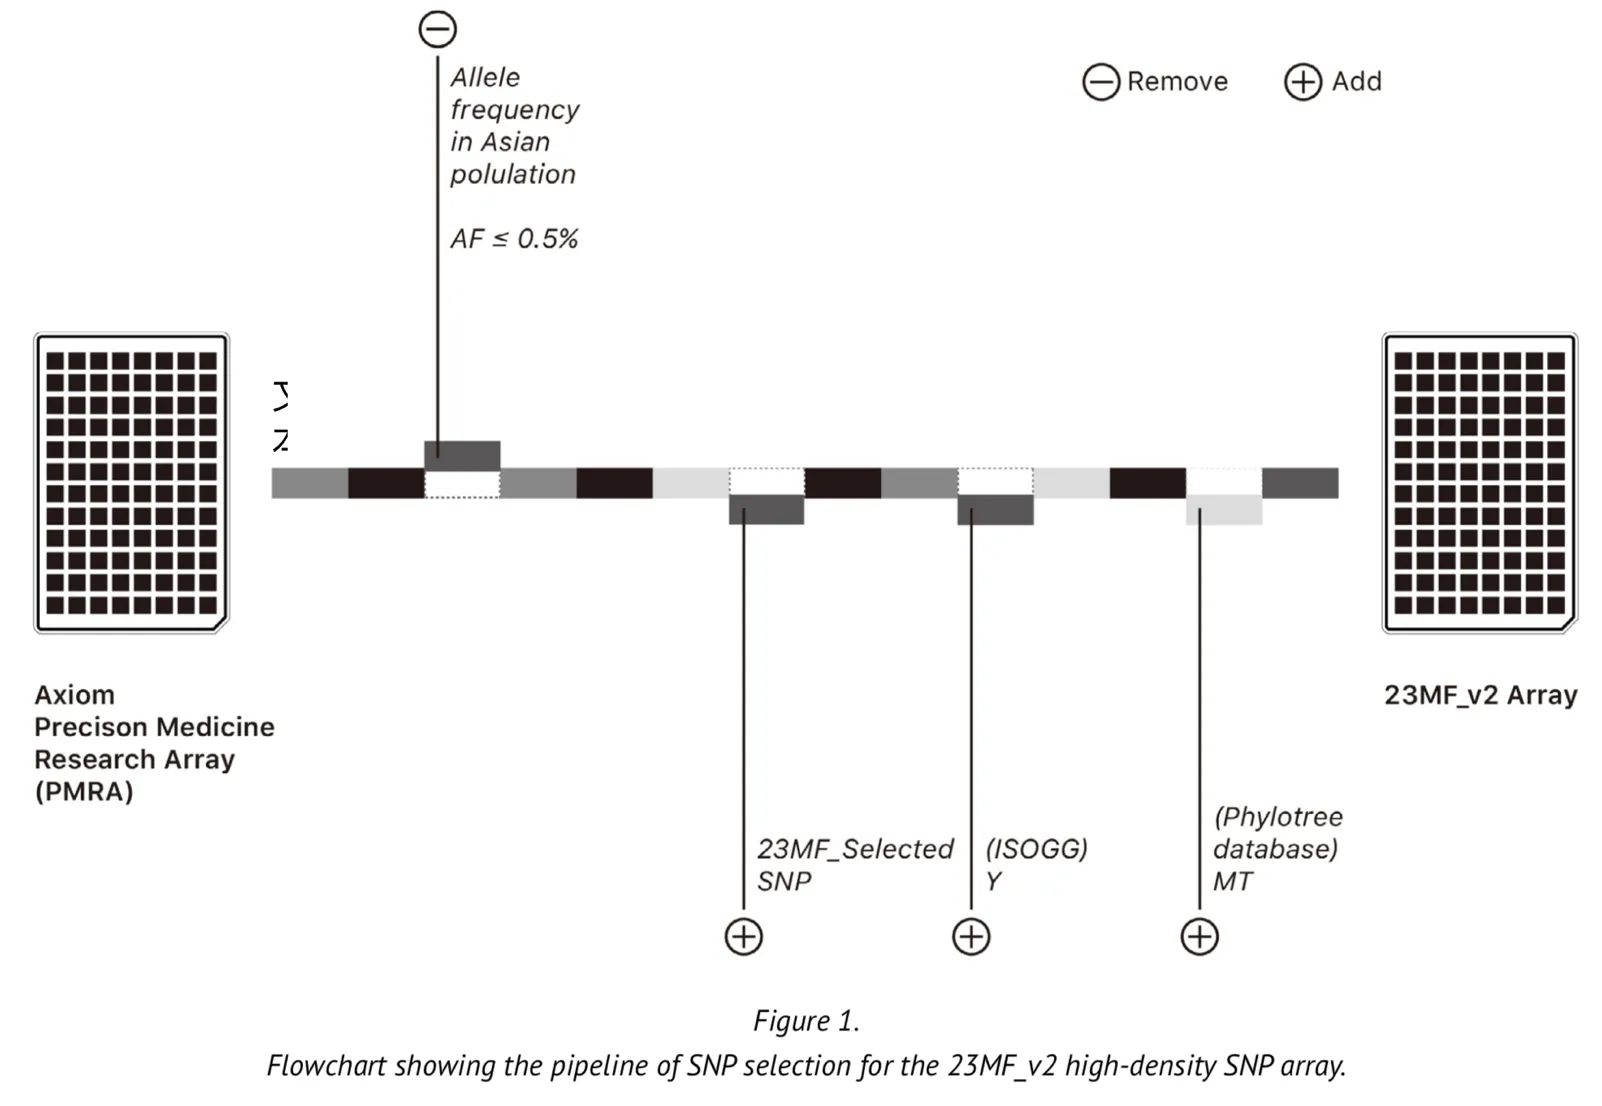
The array contains over 900000 markers but these are based on less than 3000 gene loci located on the Y chromosome and in mitochondrial (MT) DNA. The original array is therefore limited in its ability to predict ancestry. We undertook modifications to some of the loci of the array to improve its applicability to the genome of the Chinese population. The selection of the loci was based upon the following criteria: Firstly, we selected the commonest SNPs among the Asian population based upon SNP frequencies found in the database of short genetic variation (dbsnp database[1]) and the 1000 genomes database[2-5]. We then removed some loci for which the allele frequency was found to be typically low (MAF (minor allele frequency) <0.005). Secondly, we added a large number of Y chromosome loci into the array to meet the genetic ancestry report content and the research of evolution and migration of Chinese population. The Y loci were selected from the International Society of Genetic Genealogy (ISOGG) Tree, ISOGG 2017 (https://isogg.org/tree/) [6]. Thirdly, we also selected the loci that included in the array certain MT DNA loci from the phylotree database (http://www.phylotree.org/)[7], which gives a detailed view of the genetic evolution of humankind from a matrilineal perspective. Finally, we removed certain loci on the X chromosome from the array. Figure 1 represents a summary of the SNP selection for the array. As part of our design, most of the selected genetic loci were experimentally validated on the genotyping platform where the array is made, thus ensuring that the array has a high sample calling rate.
The updated Axiom PMRA now we named it as “23MF_v2”, which finally contain over 700000 loci, including GWAS loci, SNPs in clinvar database, SNPs of Y chromosome and mitochondria.
3. Performance of 23MF_v2 high-density SNP array
The number of genetic loci on the updated Axiom PMRA (700,000 loci), represents almost the maximum number possible on one single original Axiom PMRA (we had to remove 2 or 3 SNP probes if we design one new SNP probe, that is why the total number of SNPs in the new array is less than previous array). The distribution of loci in the whole genome and its comparison with an existing well known commercial chip (23andme v4 chip) are presented in Figure 2.
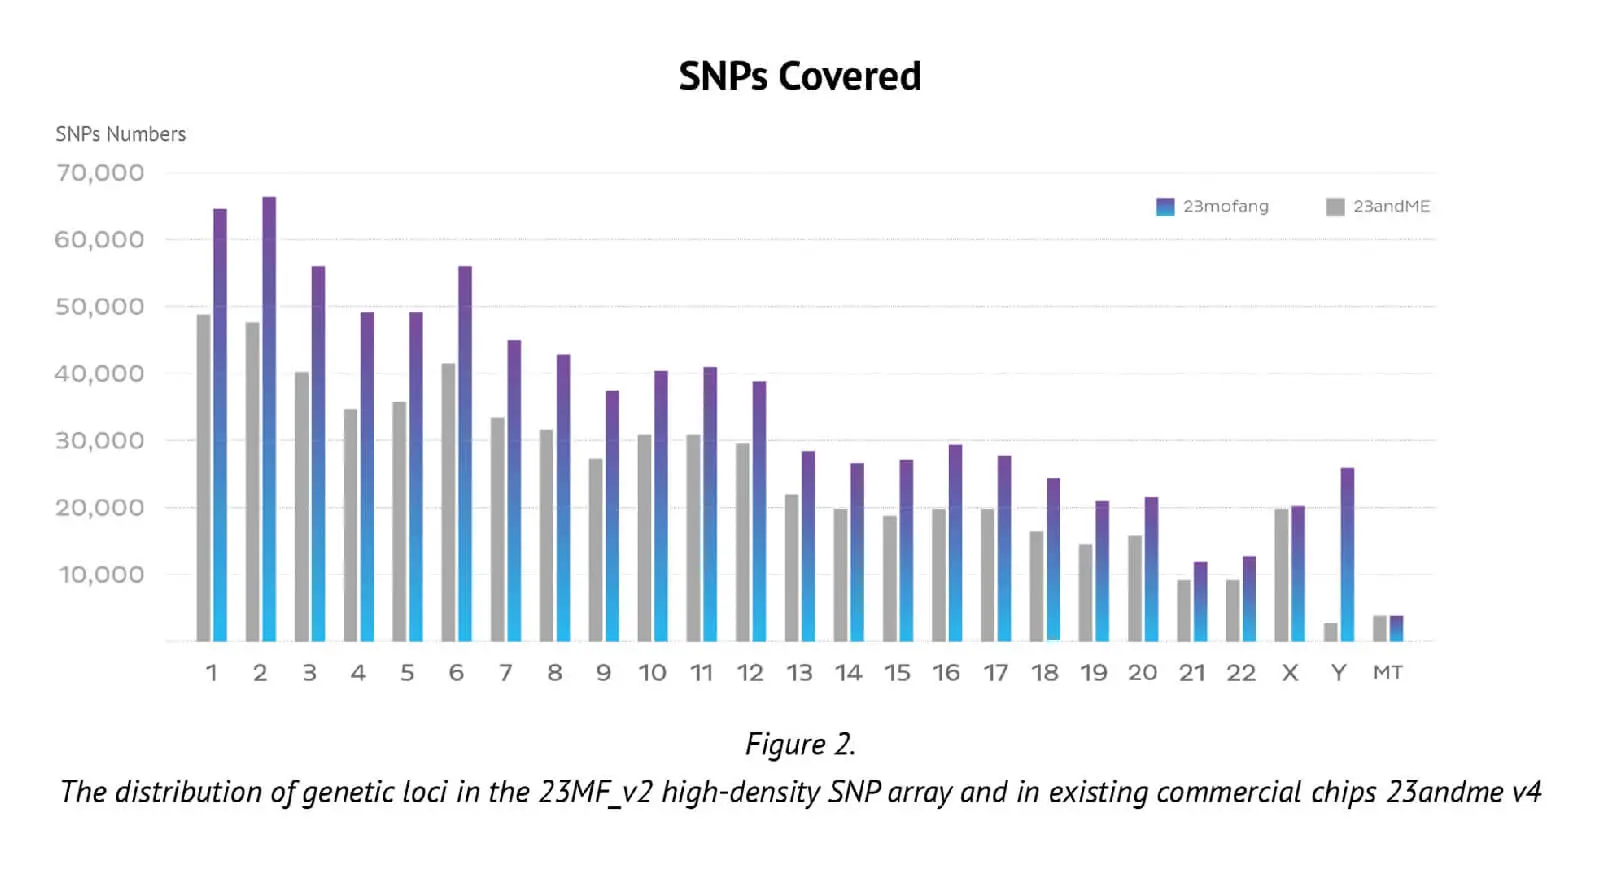
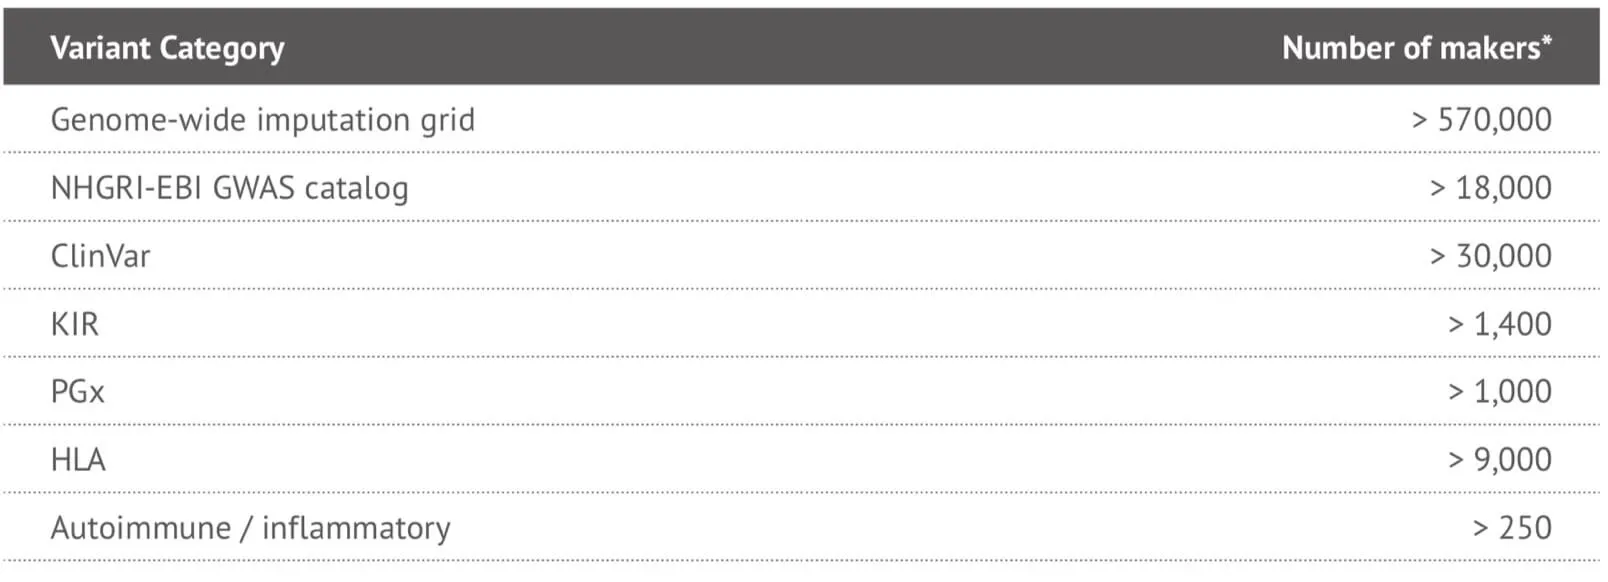
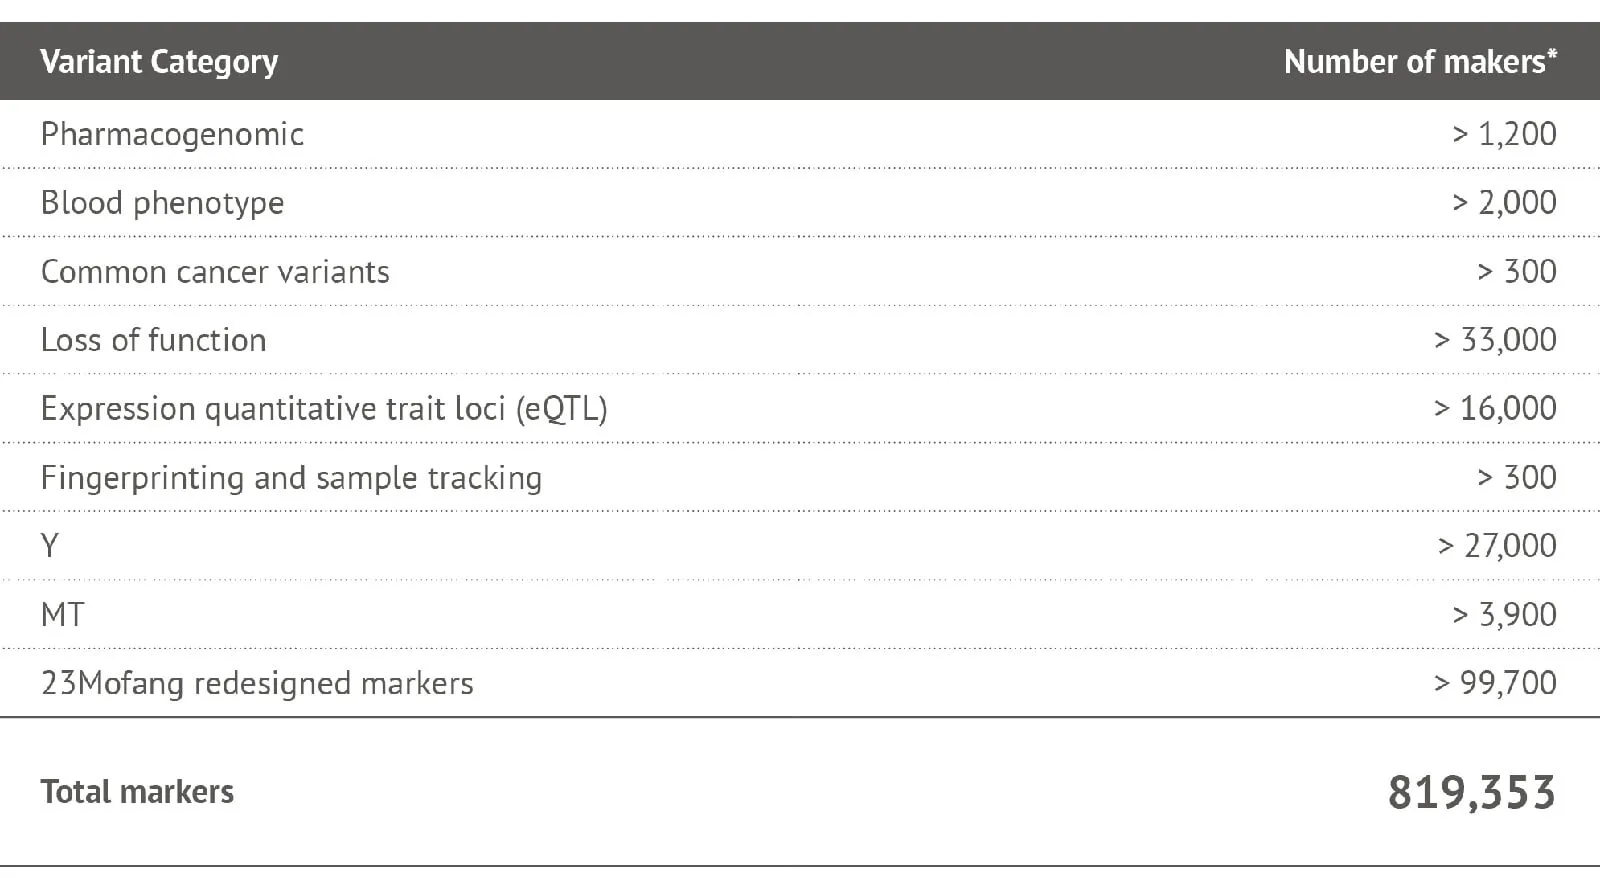
It can be seen that the locus-level genome coverage in the Y chromosome was higher for our 23MF_ v2 array compared with the 23andme v4 chip (and other existing commercial arrays – data not shown). Considerable efforts were made when designing the array panel to add in more Y haplotype SNP sites, even though this reduces the available space. The additional Y haplotype SNPs enable representation of more specific paternal haplogroups on the array, thus facilitating the ability to give consumers increased detail and clarity about their own genetic ancestry. Furthermore, the more detailed Y-SNP and Y haplotypes selected and incorporated into the array, the more genetic information can be gleaned about the migration path of the Chinese population. Other advantages of the 23MF_v2 high-density SNP array are that it contains a large number of sites from GWAS markers, precision medicine initiatives, cancer common variants and pharmacogenomics. Table 1. shows a summary of the genetic content of the array.
Table 1. Summary of the genetic content of the 23MF_v2 high-denstiy SNP array
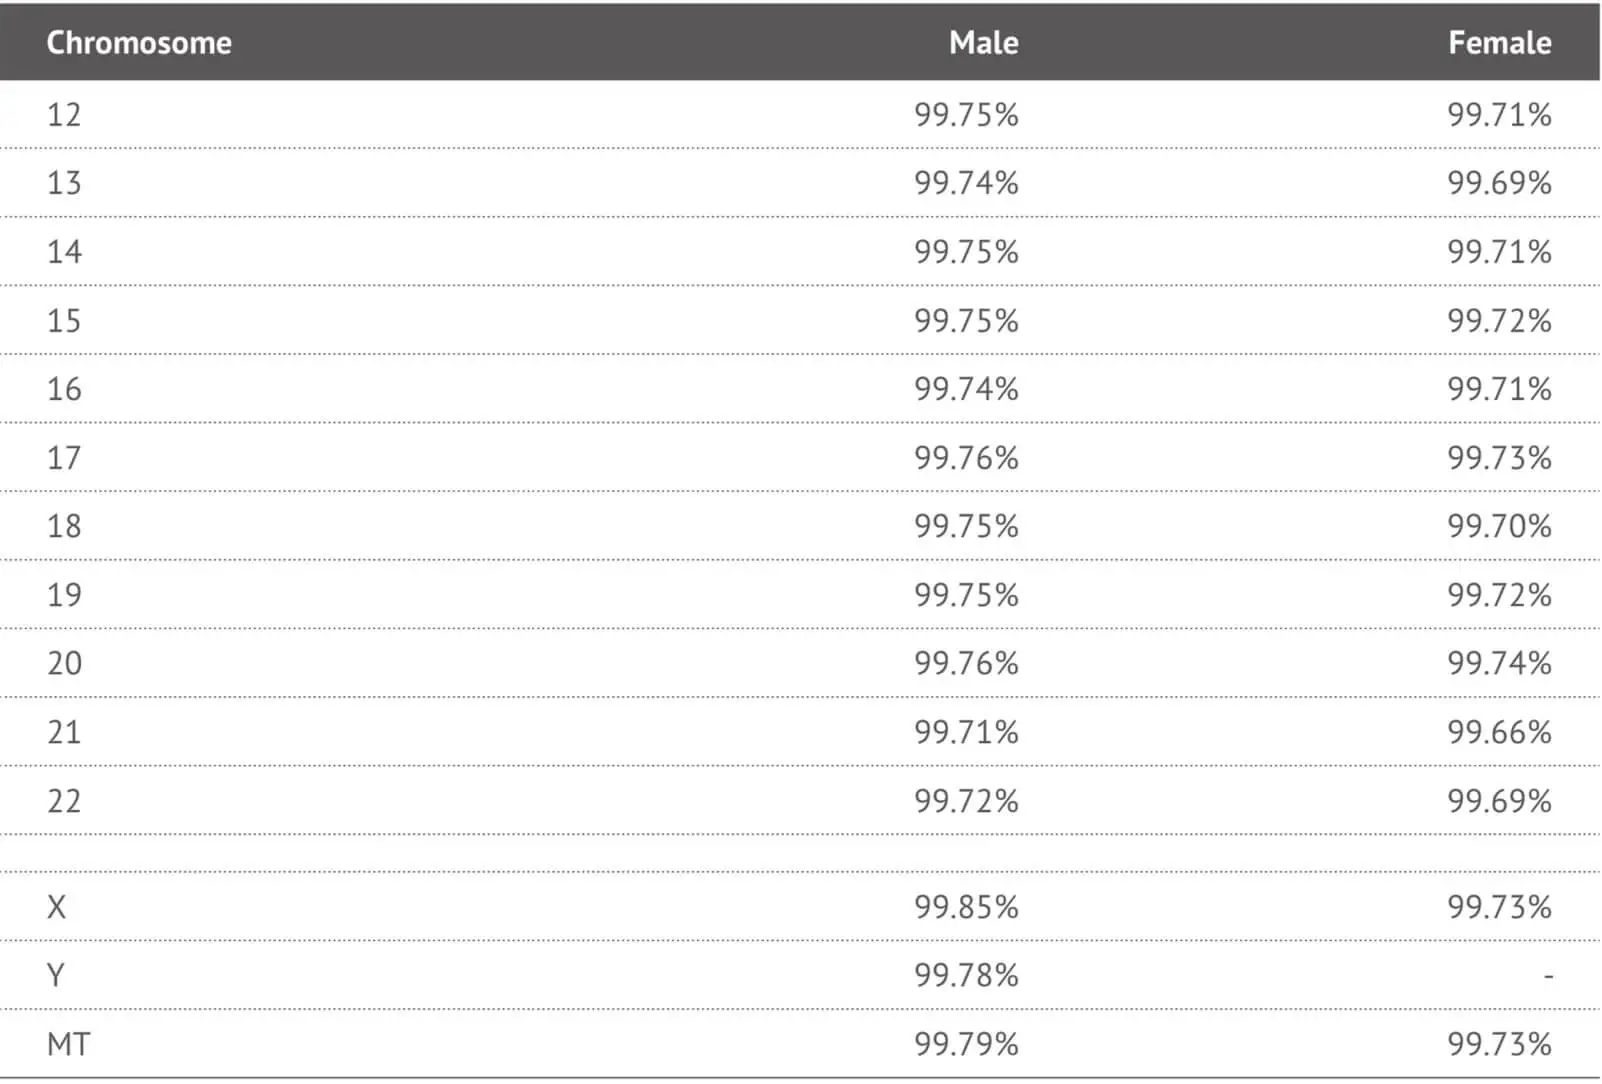
In order to validate the performance of the selected SNP probes in the 23MF_v2 array panel, we genotyped 192 human samples from the 23MoFang customer database. The average genotype call rate across samples was 99% (range 99.5% - 99.8%). Most of the probes on the array had a call rate above 99% (See Table 2). We also compared the concordance rate between the 23M_v2 high-density SNP array and the Hiseq-4000 next generation sequencing system. Concordance was 98% across the testing samples. Genotypes that failed to call or called with low quality were removed from the array.
Table 2. Call rates of each chromosomes

In summary, the 23MF_v2 high-density SNP array enables a fuller and more accurate understanding of human genome information than its predecessors. In the following section, we consider the analysis pipeline used to generate an accurate result from genomic information.
4. Analysis Guidelin
4-1. Introduction
Currently, different commercial direct-to-consumer genetic testing companies have their own internal chip analysis and quality control pipelines. This can result in different results being produced from ostensibly the same test undertaken by different companies. One reason for this is a lack of industry standards for the weighting of health risk factors. Another is that some SNPs can be difficult to genotype or may not be fully extracted from the DNA sample especially if the protocol has a low quality threshold for DNA purity / accuracy. This can produce ambiguous genetic results which are unhelpful for the consumer and reduce consumer confidence in genetic testing.
There are no formal unified guidelines for dealing with customer genetic information. Here, we publish our own detailed algorithm and the analysis “cookbook” for our array. The accuracy of the results of genetic testing using this array are highly dependent on the processes used to analyze and compute the raw data produced by the raw array. There are four main steps within our analysis guideline: a standard genotype calling method and its quality control pipeline; trios phasing, missing genotype imputation using a reference panel, and the genetic raw data output. Below, we describe each step in detail in order that it can be seen how the genotype data are generated and to ensure its high quality.

4-2. Genotype calling and QC
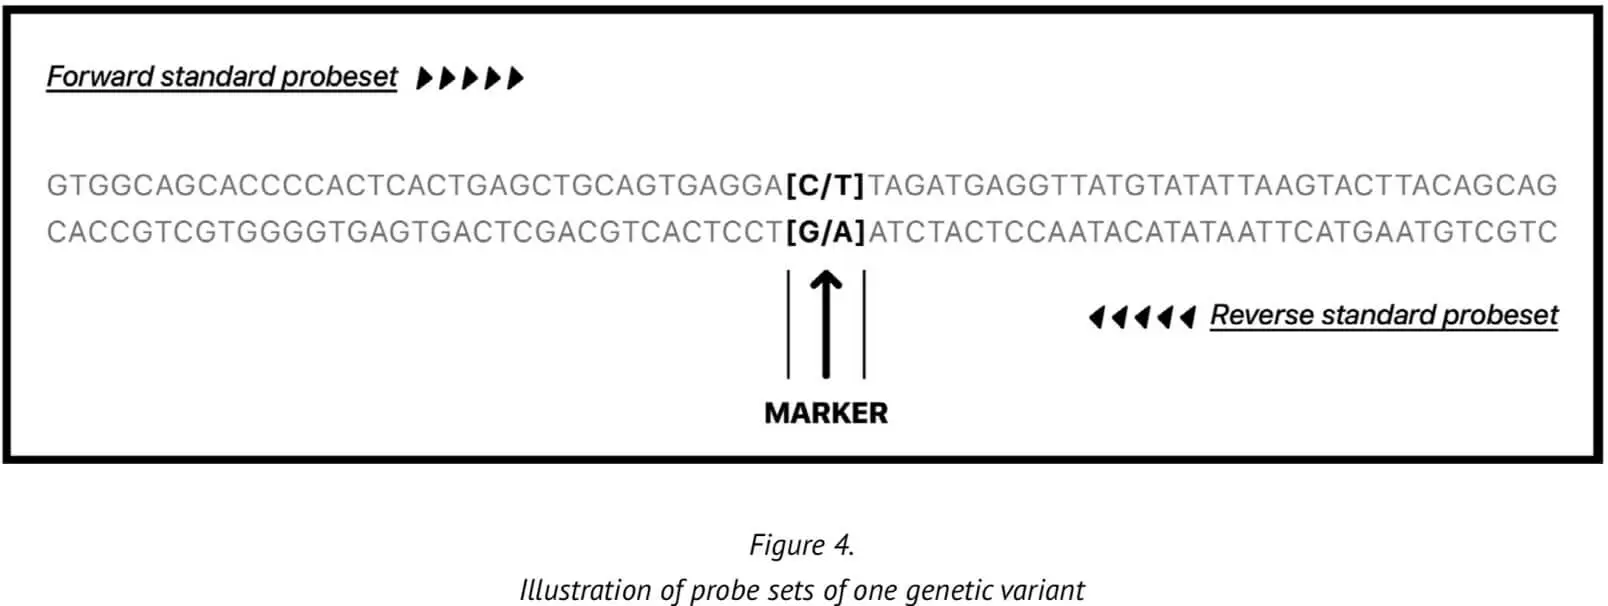
23MF_v2 high-density SNP array genotyping is based on the calling method of the Affymetrix GeneChip platform. Provision of a reliable and accurate calling pipeline is critical because accurate genotyping of the genetic variants enables relevant biological questions about the sample to be answered with increased truth/accuracy. The genetic variants are represented on two probes in the array, one derived from the forward 35-mer synthesized oligonucleotide sequence and one derived from the reverse strand sequence.
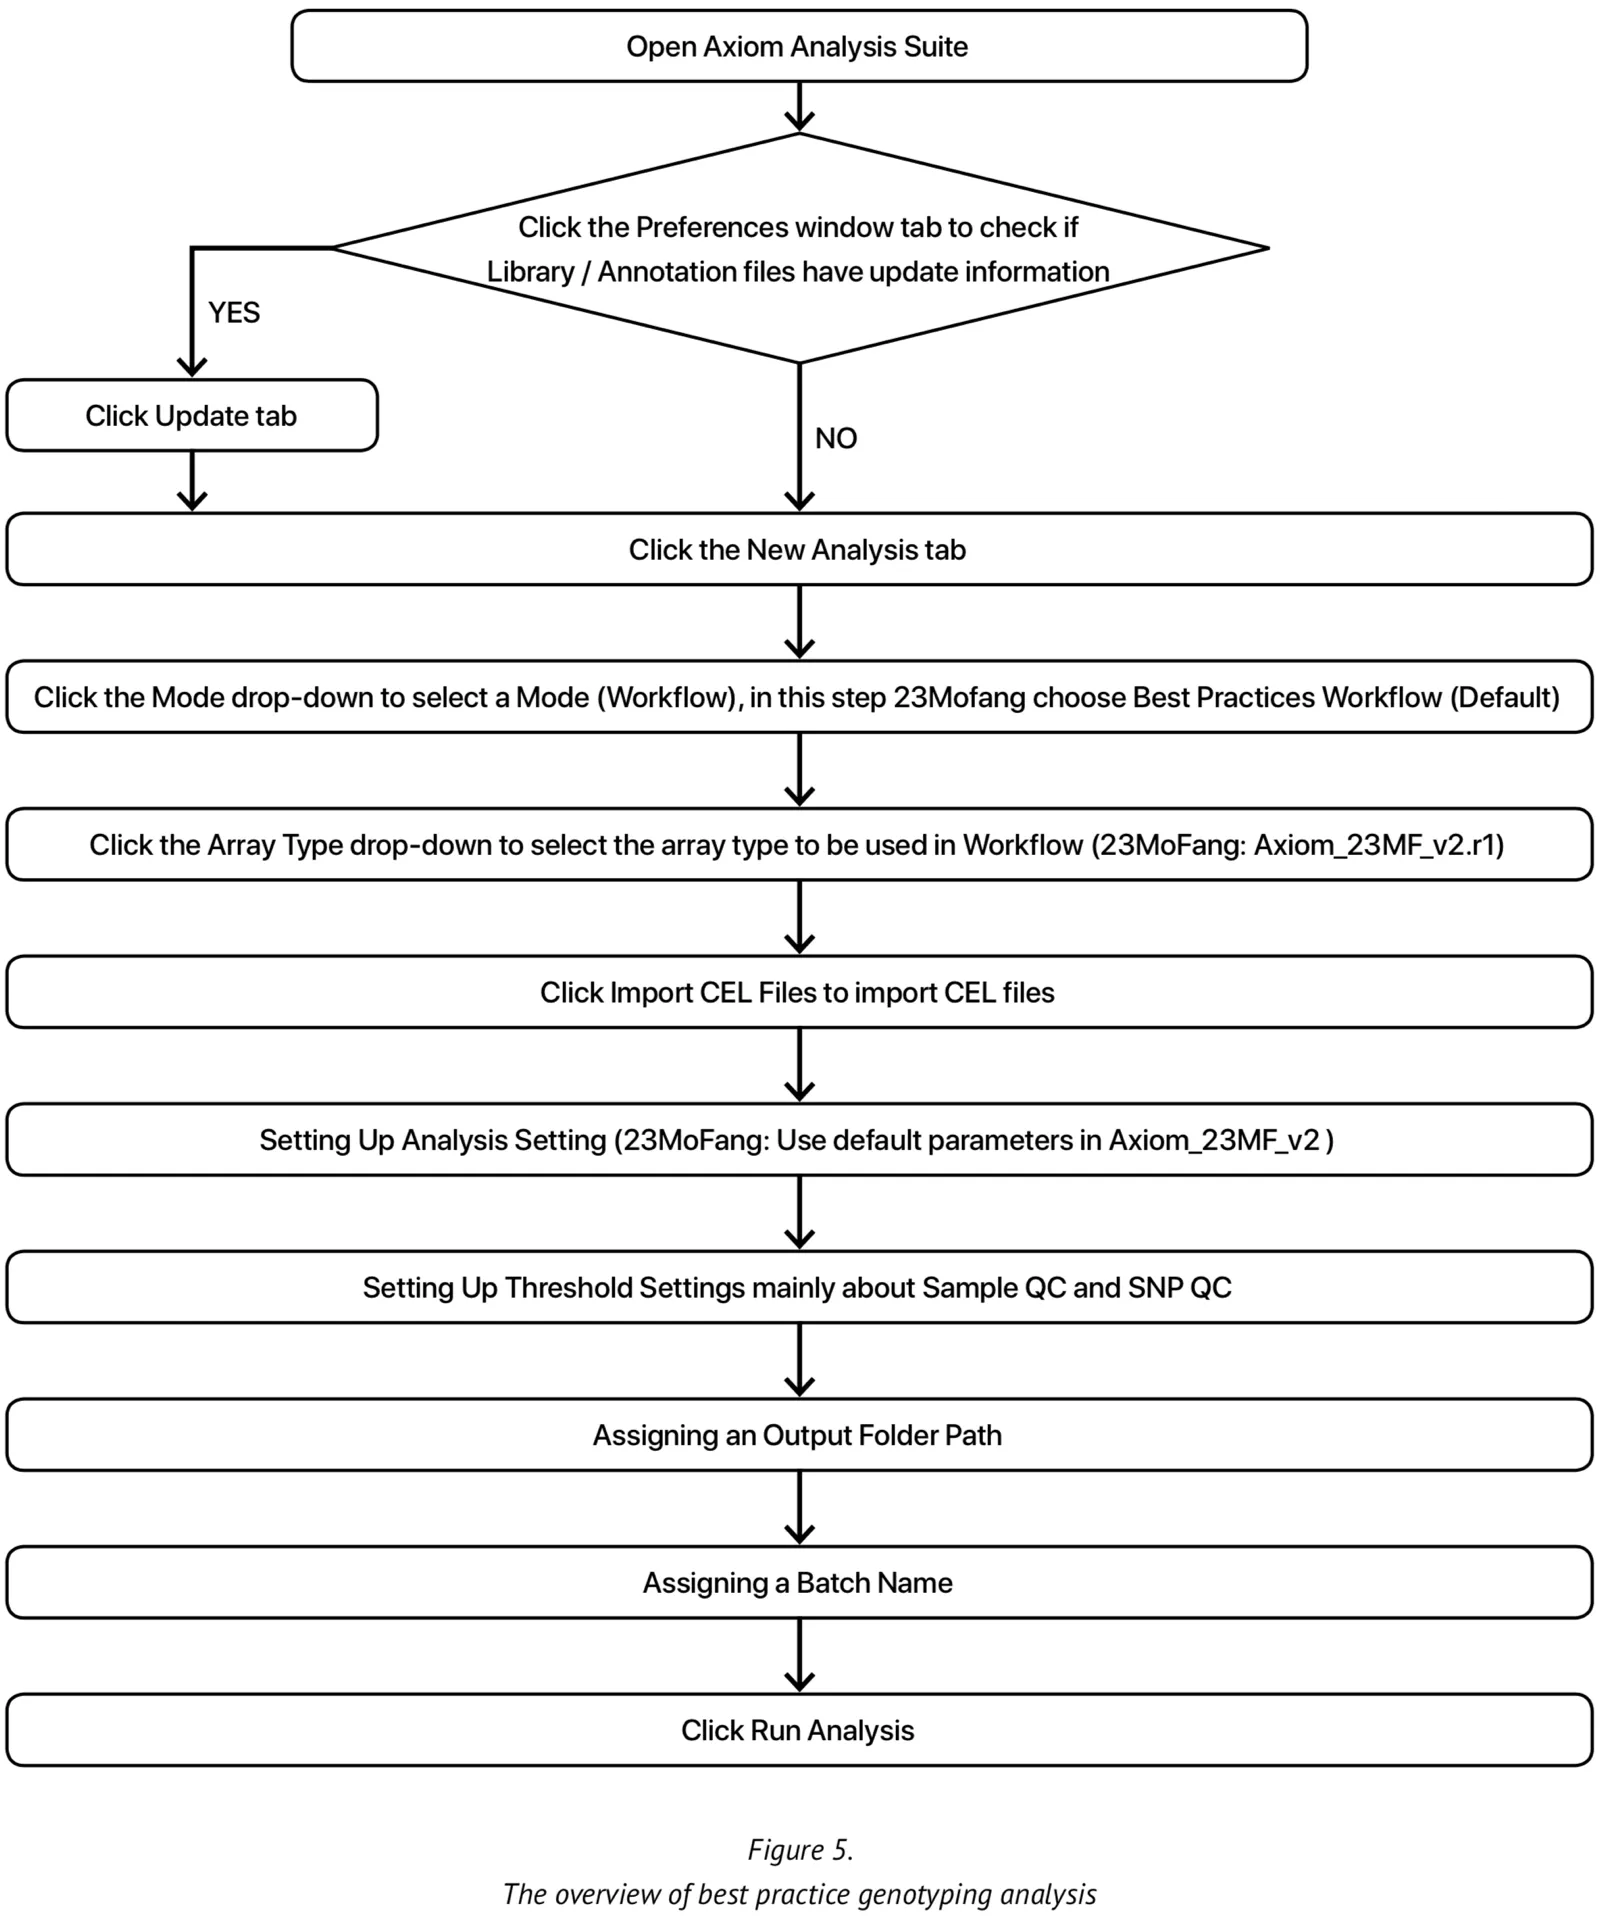
At present, our genotype calling algorithm is based on the Axiom analysis software, version 2.0, in accordance with the Best Practices Genotyping Analysis Workflow[8]. The total pipeline of this approach is set out in Figure 5. The analysis library files and the specific 23M_v2 annotation files are obtained from Axiom and unzipped into the current working library folder. Once all the internal QC parameters and running files are ready, the pipeline can be run directly.
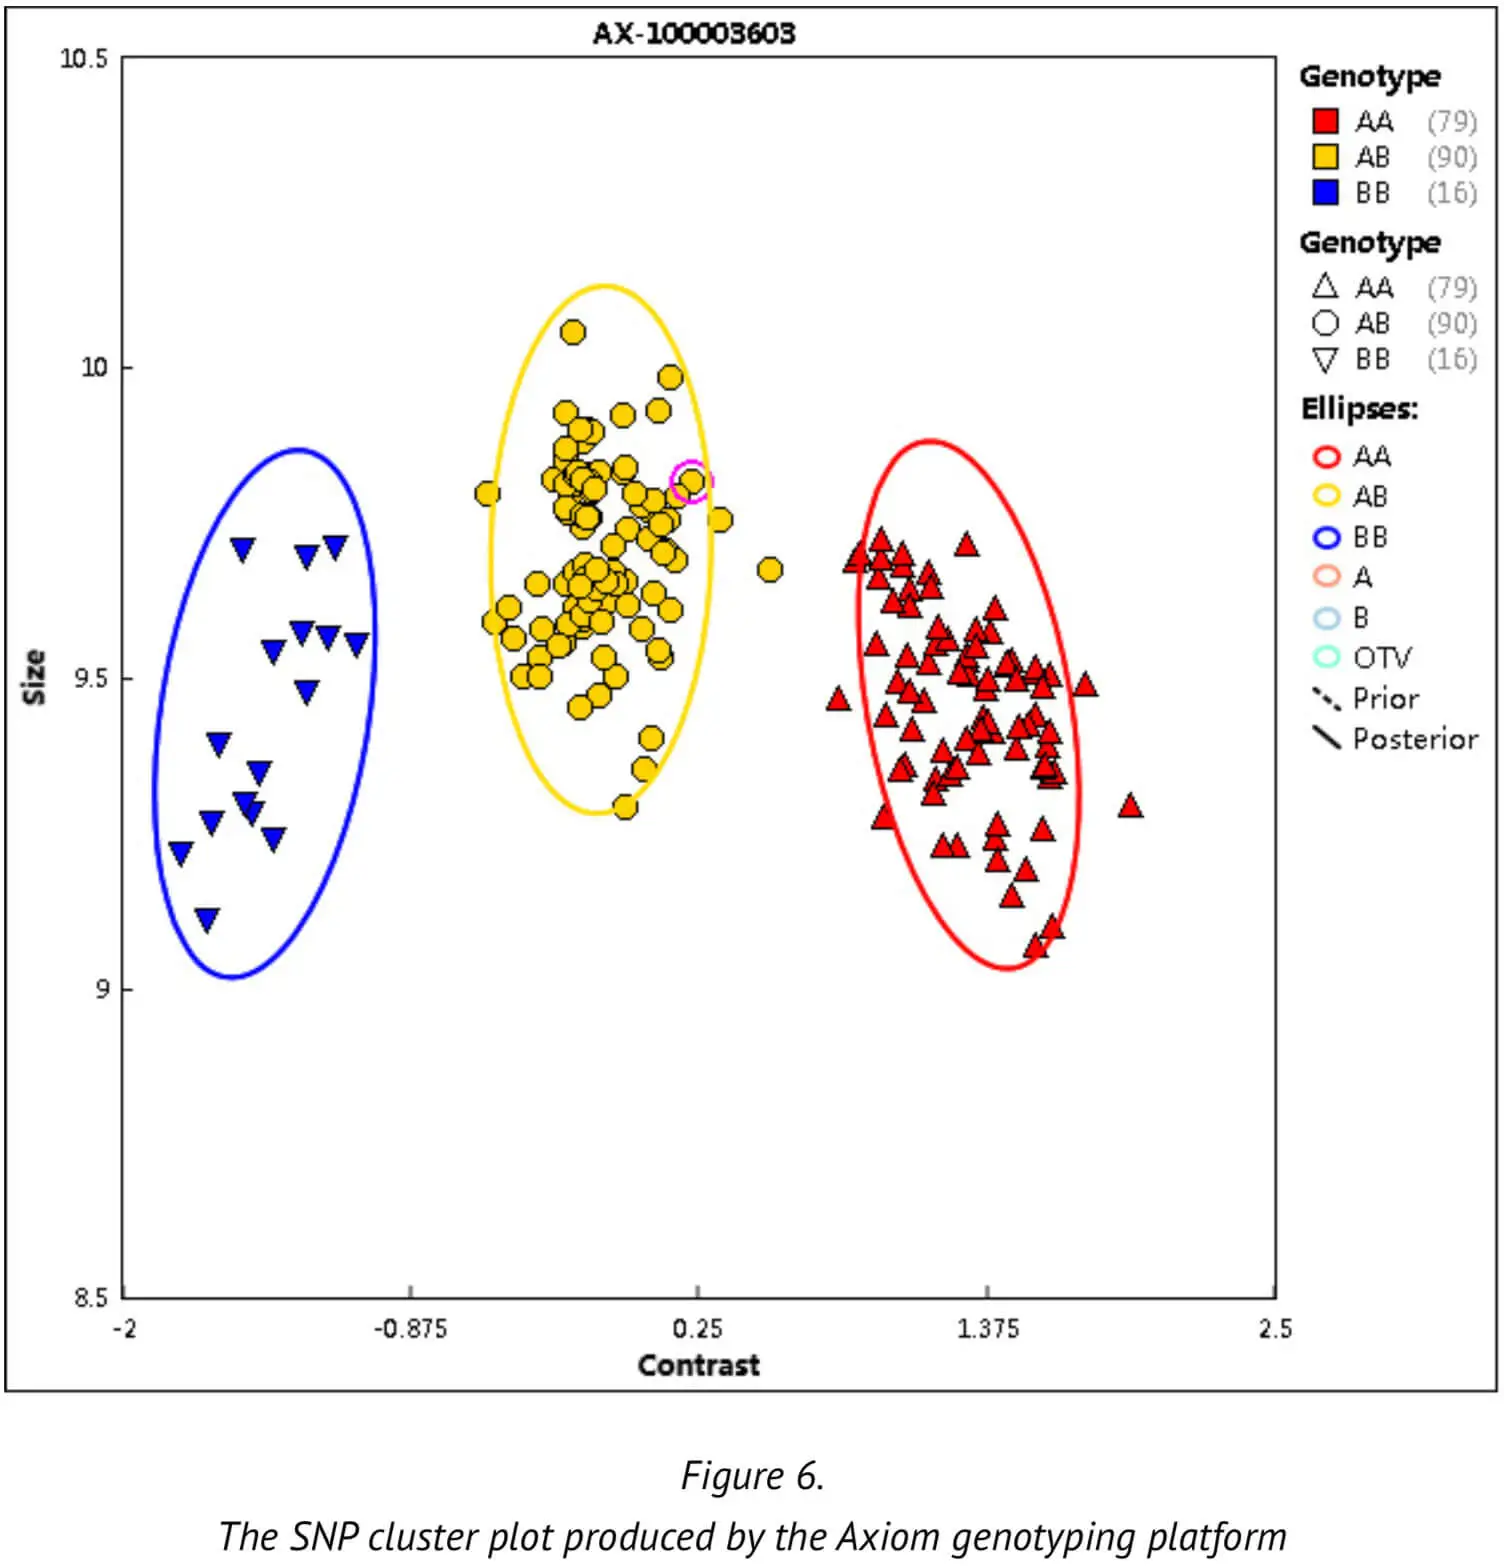
Next, we will explain the important parameters and QC definition used during the analysis in order to help enable an understanding of how the various threshold values are derived: Firstly, we describe the SNP clustering figure that is used as part of our best practice procedures. This SNP clustering figure illustrates the probe sets for one specific SNP, with each point representing one sample whose alleles A and B (intensities) have been translated into X and Y coordinates in space usingthe Axiom clustering algorithm. The resulting cluster tells us which SNP type genotype the sample in question belongs to. (Figure 6)
Secondly, the Dish QC (DQC) of a genome sample is determined. The DQC is an important parameter with which to judge the genome quality of a sample. In the Axiom assay, probes expected to ligate A or T bases will produce a specific signal in the AT channel and a background signal in the GC channel. The probes expected to ligate G or C bases will produce the opposite signal. The DQC is a measure of the resolution of the distribution of the “contract” value between signal AT and GC, defined as:
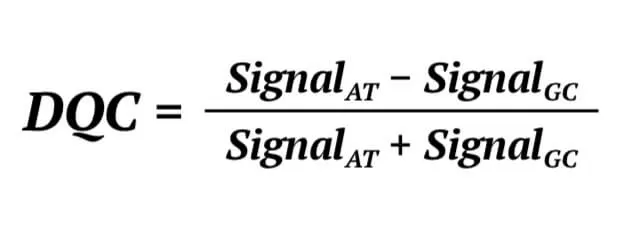
If the sample quality is good, the DQC will be high in the expected signal and low in the negative signal, and the contrast distribution will be well-resolved. If the DQC value is 1 indicates the sample is in the perfect resolution. We set the DQC threshold is 0.82, which represents that the sample would be removed if it’s DQC value is lower than 0.82.
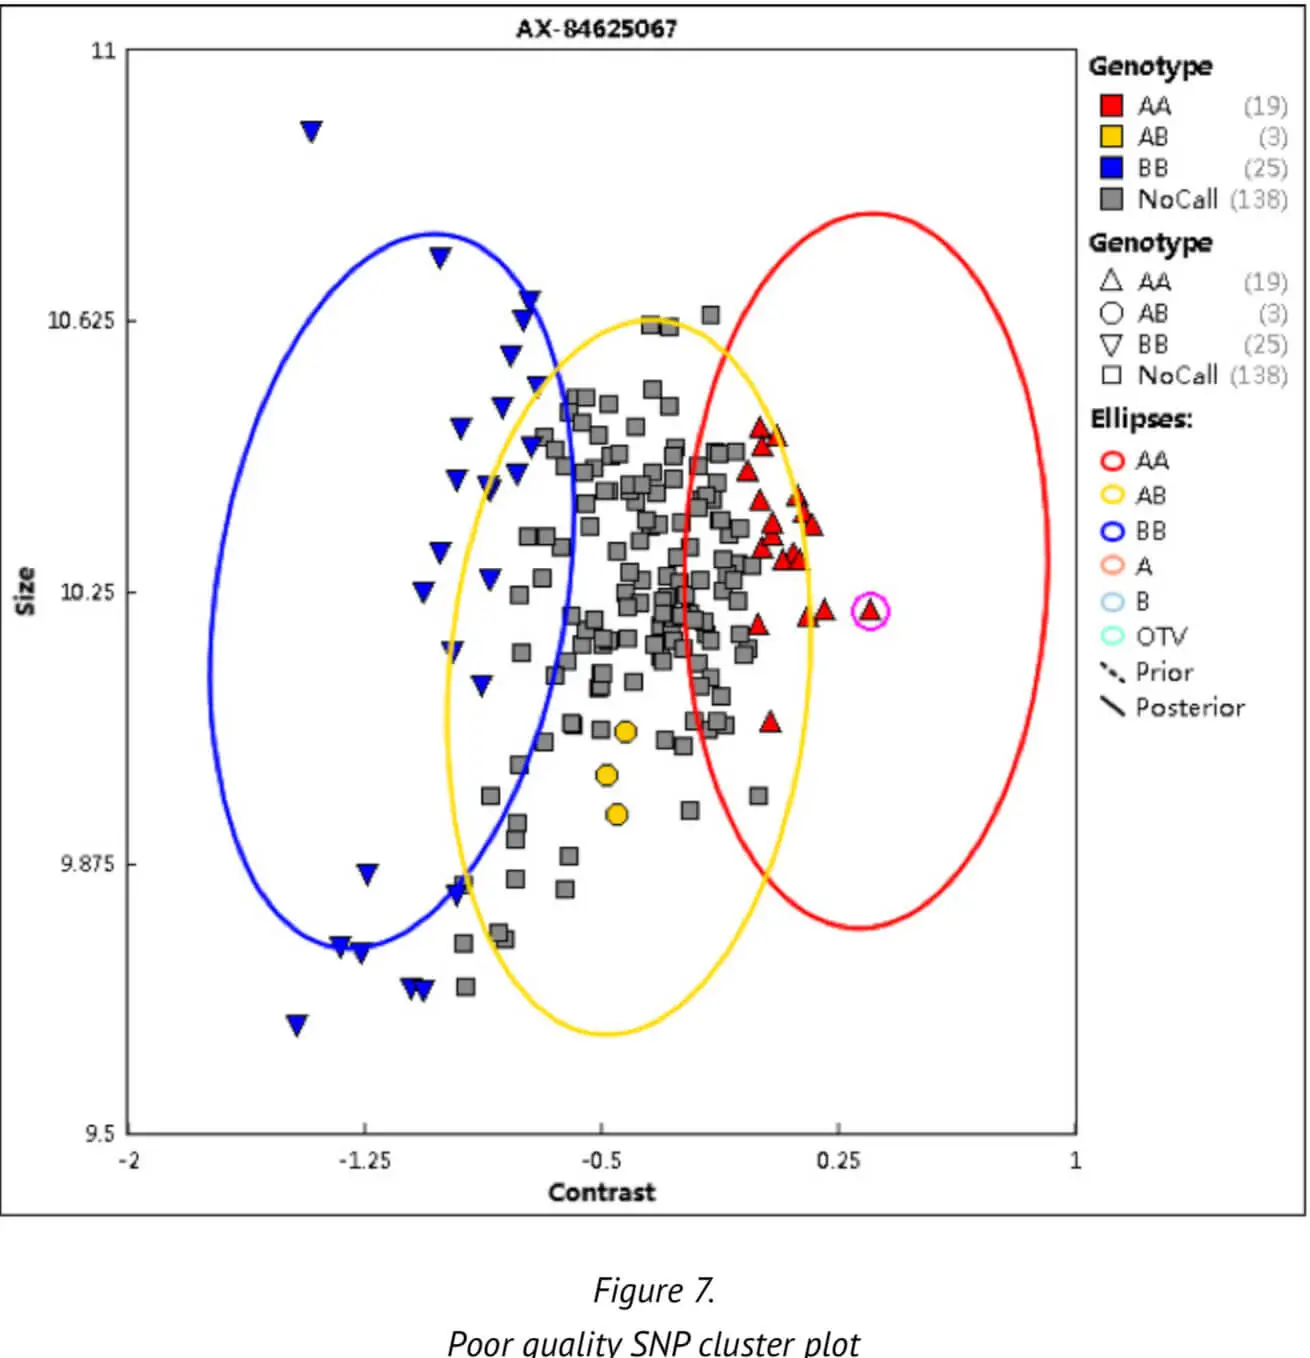
Thirdly, the SNP call rate (CR) — an important QC threshold — is calculated, which indicates the ratio of the number of samples successfully assigned a genotype of either AA, BB or AB to the number of sam-ples over which a genotype call was attempted for the SNP. The SNP call rate is a measure to check the completeness of the data and the genotype cluster quality. Poor, low genotype clusters or a non-random distribution of samples with no SNP calls may be generated by poor cluster resolution (Figure 7). A poor cluster resolution may in turn adversely affect the results of the subsequent analysis. We set a CR threshold of 0.97 to ensure the high quality of SNPs.
Apart from the above parameters and threshold values, certain other parameters are set by default as part of the Axiom Best Practices platform. These other parameters are not detailed here. To date, we have analyzed more than 30,000 samples with the our Best Practices analysis pipeline. These analyses have generated an average DQC of approximately 0.974 and an average CR of 0.995.
Below, we further illustrate how we improve data completeness in order to enable the generation of more detailed genomic information from our array system.
4-3. Phasing
In subsequent genetic analyses such as those concerning ancestry composition or genomic relatedness, it is necessary to have information about the maternal and paternal genome alleles. The genotype result from the array cannot tell us which allele copy was inherited from the paternal chromosome and which from maternal chromosome. Phasing can help to determine whether genotype matches are on the paternal or maternal side. An example to illustrate the use of phasing in this context is shown in Figure 8.
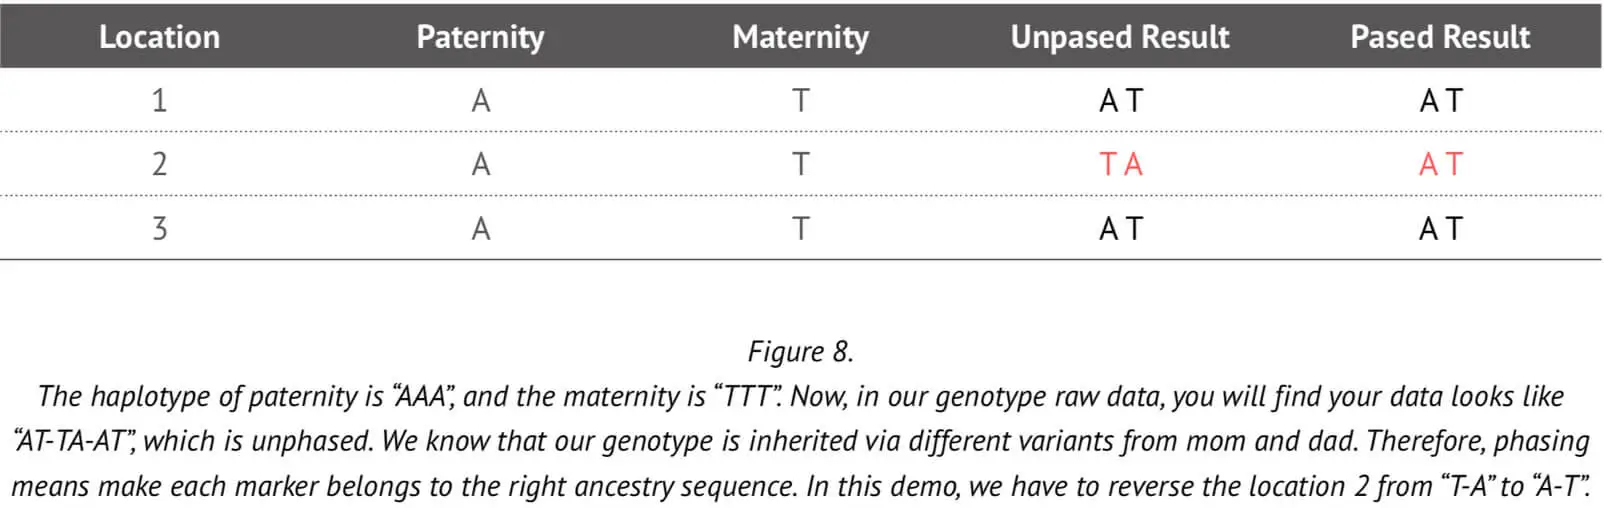
As already stated, typically the array genotype data cannot tell us which marker came from which parent. But if we have trios data, this information can readily be used to accurately assign alleles to each of the two chromosomes (paternal and maternal), as explained in the above Figure. However, it is very unlikely that we would have the trios information for all 23Mofang customers. Therefore, a more sophisticated method is needed to accurately phase the genotype that can determine which allele is assigned to which chromosome without trios information.
In our approach, we phase the genotype dependent on the trios information and the haplotype of the reference population. If our customers were genotyped (DNA test) with their parents, we will combine their trios data to phase their sequence to the correct parental side. On the other hand, if we have no trios data, the best principle is to phase two sequences on each chromosome, that are also observed in the general population. This method is based on the haplotype in a single population, which is typically shared by many people in a large population.
Next, we evaluate the accuracy of phasing by comparison with 100 trios of data contained in the 23MoFang database (because they all belong to a trio and for the trios in the database we know which allele is correctly in its right side). To assess the phasing accuracy, we consider the switch error (percentage of possible switches in the haplotype orientation), that is widely used as a measure for evaluating phasing accuracy. The switch error rate is equal to the number of switches between the true phased sequence and the inferred phased sequence, divided by the number of heterozygous sites. The switch error (phasing error) rate associated with our analysis pipeline is currently approximately 1.7%.
4-4. Imputation
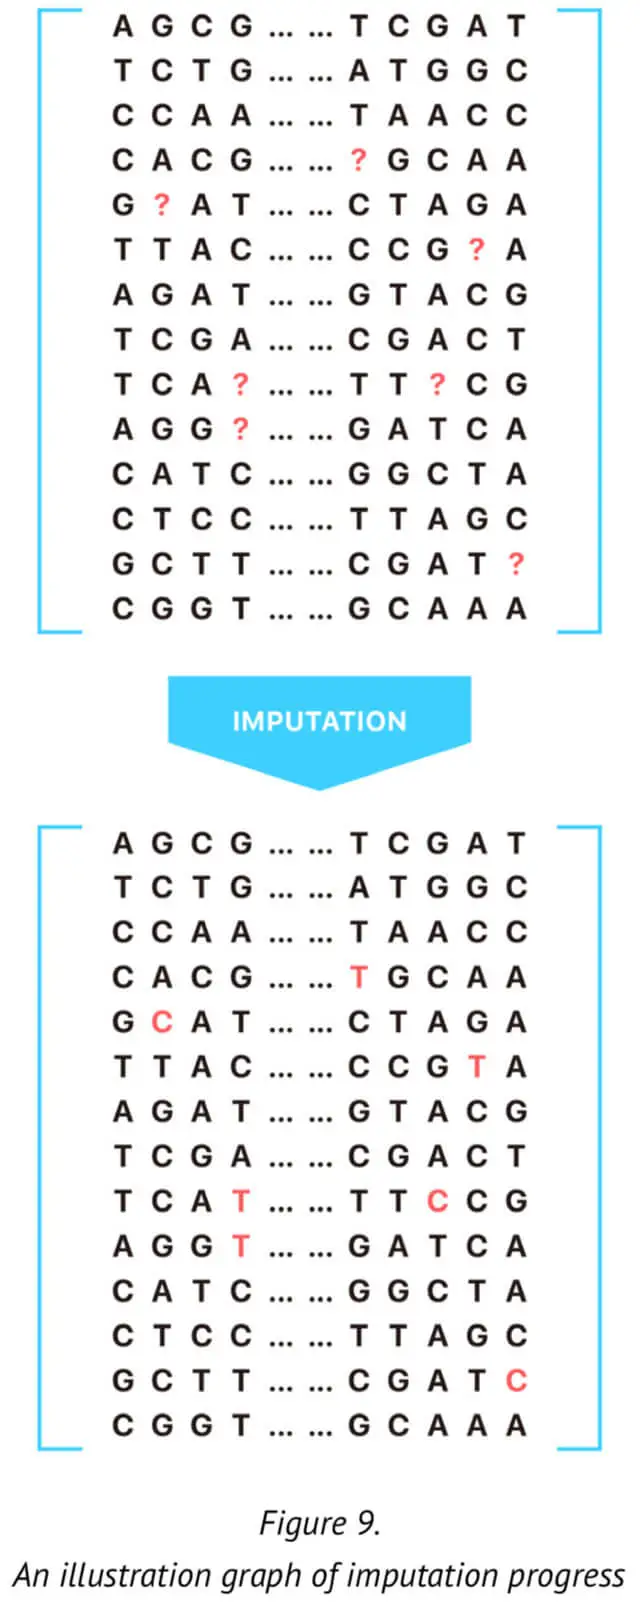
Another major challenge of commercial SNP density arrays is that sometimes a critical SNP may go un-detected because of its low genotype quality or the randomness of the biological experiment. However, such “missing” data may have a significant influence on the accuracy of the genetic report provided to the customer, especially in relation certain important diseases or traits.
For this reason, it is critical to regenerate the genotypes of certain markers (SNPs) using mathematical approaches. This process is called imputation (See Figure 9.). Here, we present our approach for genotype imputation that increases the accuracy and computational efficiency of certain specific and significant markers. The method described here is based on the current imputation algorithm and provides an extremely efficient strategy for genotype imputation.
According to our approach, for the imputation of one untyped SNP loci, we would make the reference panel that included all the typed SNP loci. Specifically, we selected n SNPs before and after the target SNP to compose the reference panel. This reference training set containing the haplotype sequence of the population is generated by our 23MoFang database. The imputation of missing genotype at certain specific SNP loci is based on the reference haplotypes or the haplotype generated from the available genotype data for the population under study. In order to improve the genotype imputation accuracy, we adoptedthe genotype data whose family information is available in the reference panel. The reference panel is used with the genotype data after phasing training.
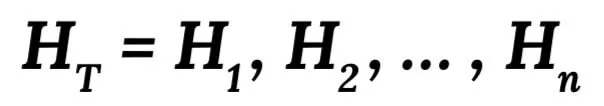
We introduce our local (specific) genotype imputation along with some important genotype markers which also have a high-missing rate in the array data. Our model is estimated from training haplotype data using the hidden Markov model. According to this model, the original haplotype is firstly labelled as H1, H2, ..., Hn, and the haplotype training set is regarded as:
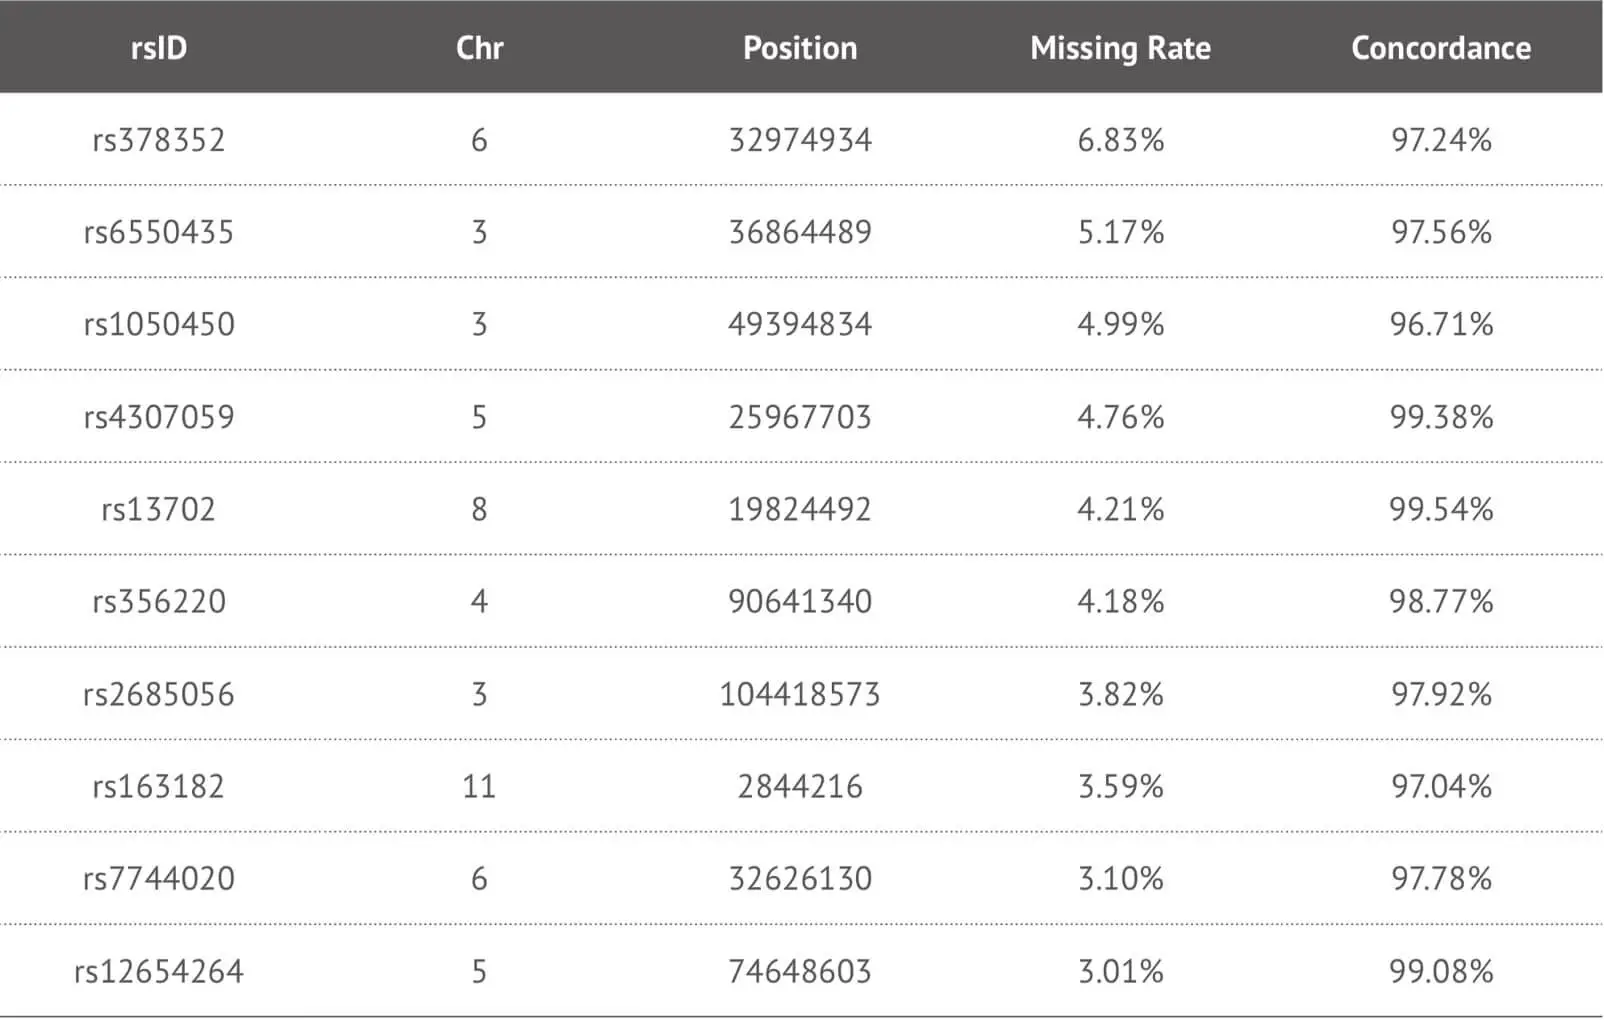
Our data suggest that our imputation approach is highly accurate when it was applied to our target high-missing rate SNPs. Due to the fact that this method enables us to provide more detailed SNPs loci information to our customers, we specifically impute some key SNPs loci in the genome report and herein show the imputation performance of some key SNPs loci (Table 3). In order to evaluate the accuracy of imputation, we chose 4,000 samples as training dataset and 660 samples as test dataset from our 23MoFang database. Through the imputation algorithm we developed, we choose the imputed genotype results for the missing SNPs loci whose imputation concordance can reach 0.97, and filter out some unsuitable imputed SNPs loci because of their low quality. These results are tested by not only the method mentioned above, but also the tool Beagle 4.1 developed by Brian et al. If some meaningful SNPs loci are “no call” and cannot be imputed correctly, these can be separately genotyped by other experimental methods.
5. Raw array data
Following application of the Best Practices Genotyping Analysis Workflow, we provide customers with their raw data file. The file corresponding to the example dataset is:
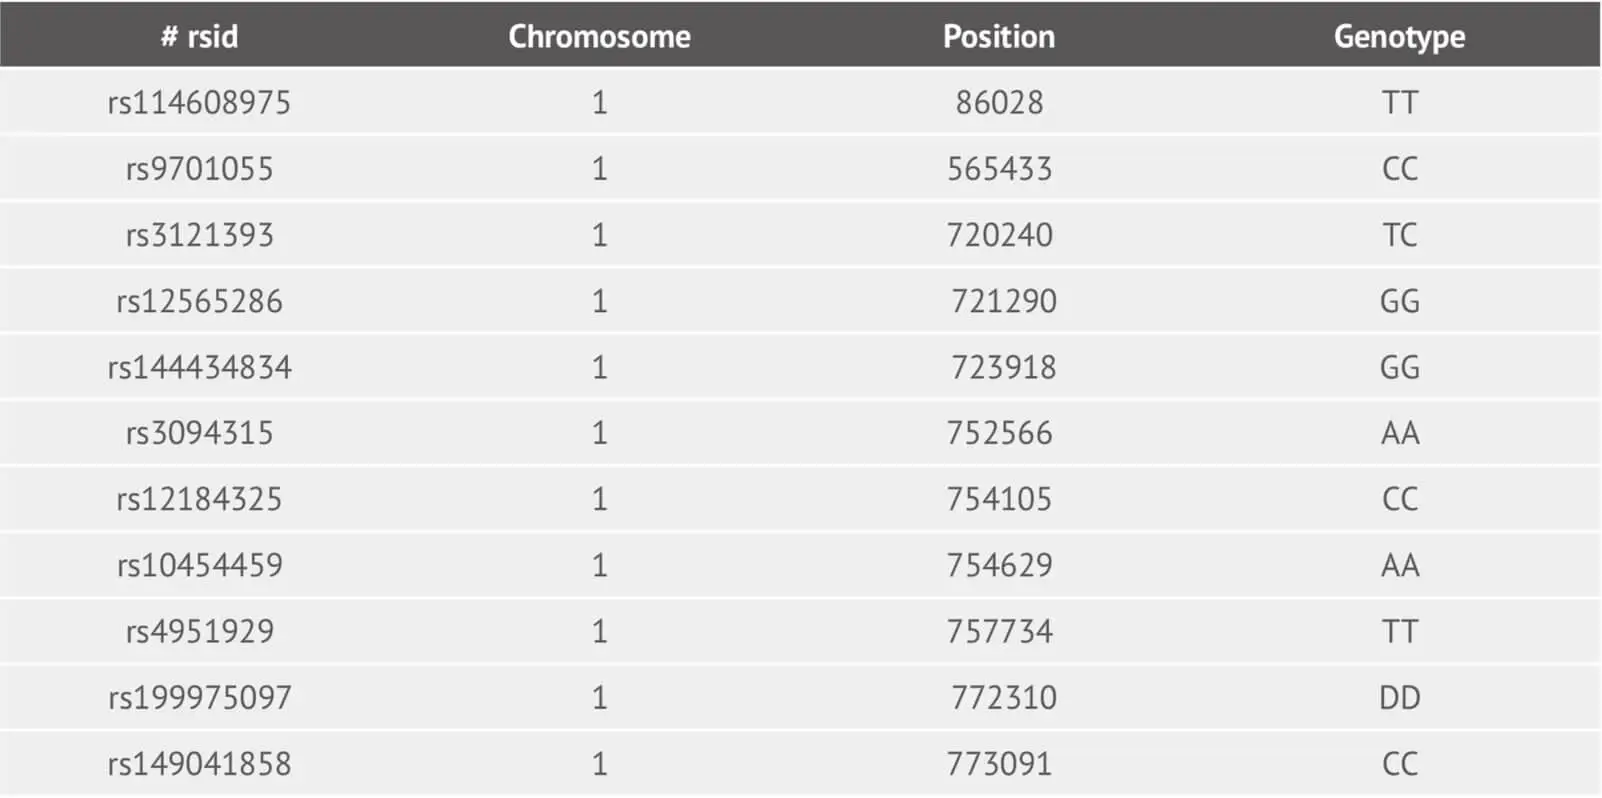
This is a tab-delimited text file and its each line corresponds to one genetic marker (SNP and Indel). For column one, we provide the SNP identifier where is an rsID or internal id. The column two and three represent the chromosome and its basepair position using reference human assembly build 37(GRCh37). The genotype SNP is in the last column.
6. Future Refinement
In order to continue our mission to provide high quality detailed genotype data, 23MoFang will continue to improve our SNP array and analysis workflow. Currently, we are working to further improve the imputed precision and enhance the coverage of imputation. At the current time, only certain critical and good quality SNPs loci can be imputed. On the other hand, we also add more Y loci to provide more genetic information of paternal line. Each analysis workflow release update will further refine and improve the genotype data quality, for the ultimate benefit of our customers.
Reference
- 1. Sherry, S.T., et al., dbSNP: the NCBI database of genetic variation. Nucleic Acids Res, 2001. 29(1): p. 308-11
- 2. Abecasis, G.R., et al., A map of human genome variation from population-scale sequencing. Nature, 2010.467(7319): p. 1061-73.
- 3. Abecasis, G.R., et al., An integrated map of genetic variation from 1,092 human genomes. Nature, 2012.491(7422): p. 56-65.
- 4. Sudmant, P.H., et al., An integrated map of structural variation in 2,504 human genomes. Nature, 2015.526(7571): p. 75-81.
- 5. Auton, A., et al., A global reference for human genetic variation. Nature, 2015. 526(7571): p. 68-74.
- 6. Jobling, M.A. and C. Tyler-Smith, The human Y chromosome: an evolutionary marker comes of age. Nat Rev Genet, 2003. 4(8): p. 598-612.
- 7. Van Oven, M. and M. Kayser, Updated comprehensive phylogenetic tree of global human mitochondrial DNA variation. Hum Mutat, 2009. 30(2): p. E386-94.
- 8. Nicolazzi, E.L., D. Iamartino, and J.L. Williams, AffyPipe: an open-source pipeline for Affymetrix Axiom genotyping workflow. Bioinformatics, 2014. 30(21): p. 3118-9.